

Long-form analysis / Match analysis
What did VAR change in Turkish football?
Eight seasons on each side test expectations of more goals, more penalties and less home advantage. The results resist a single-technology explanation.
Updated: 29 October 2026
From one disputed incident to the league
Everyone can recall a VAR incident: a disallowed goal or a reversed penalty makes the effect on one game visible. The harder question is what repeated interventions changed across the league. More goals, less home advantage, better results for particular clubs? We examined many consistently counted matches rather than one disputed event.
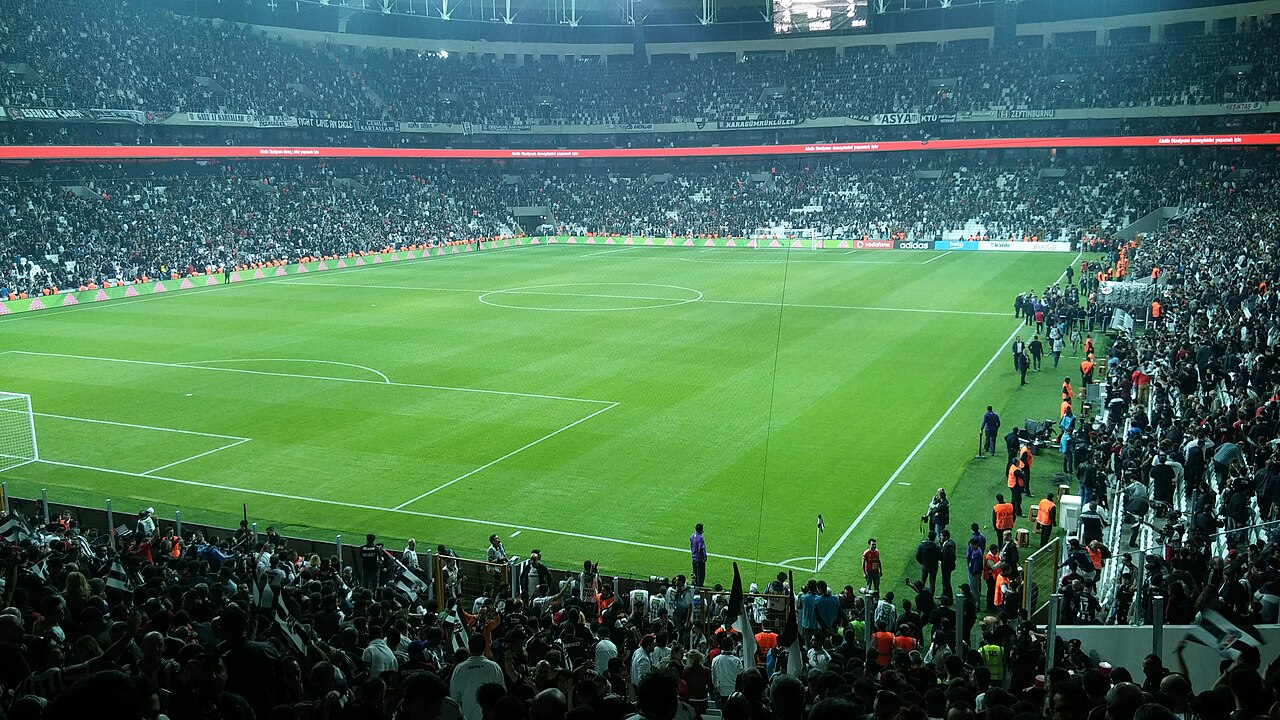
Photo information
Image record and usage information ↗Two equally long periods
VAR began in the Süper Lig in 2018/19. We compare the eight completed seasons through 2025/26 with the preceding eight: 2010/11–2017/18 and 2018/19–2025/26. The comparison contains 5,198 played regular-season games, excluding awarded results and play-offs.
Rates pool all eligible matches; differences are percentage points.
Table values
| Measure | Before VAR | After VAR | Change¹ |
|---|---|---|---|
| Goals / match | 2.73 | 2.81 | +0.08 |
| Home wins % | 46.24 | 44.73 | -1.51 |
| Draws % | 25.18 | 26.24 | +1.05 |
| Away wins % | 28.58 | 29.03 | +0.46 |
| 0–0 share % | 8.34 | 7.19 | -1.15 |
| Both teams scored % | 53.48 | 56.43 | +2.96 |
Goal-type subset · seven seasons before, eight after; own goals excluded
| Measure | Before | After |
|---|---|---|
| Penalty-goal share % | 8.4 | 11.48 |
| Header share % | 18.17 | 17.34 |
| Foot share % | 73.43 | 71.18 |
2025 study · separate four + four season sample · 1,224 and 1,412 games
| Per match | Before | After | Study test |
|---|---|---|---|
| Yellow cards | 4.59 | 4.32 | Significant |
| Red cards | 0.28 | 0.28 | Not significant |
| Penalties awarded | 0.32 | 0.42 | Significant |
| Fouls | 31.82 | 26.21 | Significant |
| Offsides | 4.04 | 3.71 | Significant |
No large jump in scoring
Goals per game rose from 2.73 to 2.81, about 2.8% or one extra goal per 13 matches. Both-teams-scored games increased from 53.5% to 56.4%. There is an increase, but not the kind of large jump implied by the idea that VAR immediately transformed scoring.
The timeline complicates that account too. The final pre-VAR season averaged 2.96 goals and the first VAR season 2.68. Later campaigns reached both 3.05 and 2.65. Such variation under the same broad technology label requires attention to squads and playing conditions before assigning the whole change to VAR.
2018/19 is the first VAR season; regular-season matches excluding awarded scores.
The pandemic changes the home-advantage comparison
Home wins fell from 46.24% to 44.73%, which might initially suggest review technology reduced home advantage. Excluding 2019/20 and 2020/21 raises the later figure to 45.61%, shrinking the gap from 1.51 to 0.63 percentage points. A result so sensitive to pandemic seasons is difficult to attribute solely to VAR.
The check removes whole seasons, not only closed-door games. It is not a controlled experiment, but it shows how robust the explanation is. Years with different crowd conditions cannot simply be treated as ordinary observations of the same environment.
Squads, coaches and opponent strength were not controlled; this is not a ranking of refereeing effects or benefits.
Club results did not move together
Galatasaray’s win rate rose from 57.7% to 65.2% and Trabzonspor’s from 45.0% to 51.2%. Fenerbahçe fell from 62.5% to 60.1% and Beşiktaş from 56.3% to 52.1%. Turning that into a list of VAR beneficiaries would ignore changing budgets, squads and coaches. These are club performance periods, not measurements of favourable decisions.
Did penalties take a larger share of goals?
Within verified goal classifications, penalties accounted for 8.4% before and 11.48% after. Headers moved from 18.17% to 17.34%. Own goals are excluded consistently. Missing 2011/12 classification means this subset compares seven seasons with eight, not the identical sample used in the results table.
Penalty-goal share is not the frequency of penalty decisions. Misses are absent and finishing changes the denominator. The share returned to about 9.1% in 2025/26. A higher period average is neither a continuously rising trend nor an effect attributable solely to VAR.
What do cards, fouls and offsides show?
Cards and refereeing decisions use the 2025 Süper Lig study’s separate four-season-before/four-season-after sample. Our complete eight-season card series remains unavailable, so the samples are not merged.
The study finds significant changes in cautions, penalties, fouls and offsides, but not goals or red cards. Fewer cautions alone need not mean less physical football.
How robust is the small scoring rise?
We tested how sensitive the roughly 0.08 goals-per-game rise is to the seasons selected. Resampling the eight seasons in each period produced a 95% interval of -0.04 to 0.19 goals per game, including zero. That does not support a stable jump repeated uniformly across seasons.
Draws rose from 25.18% to 26.24%, so the share of decisive matches declined slightly. Goalless games fell from 8.34% to 7.19%. Fewer 0–0s need not mean fewer draws: scoring draws can increase at the same time.
Testing VAR against its actual purpose
We find a small, fluctuating scoring rise and a home-advantage difference sensitive to the pandemic check. Neither proves VAR ineffective nor establishes a wholesale transformation. Current advanced data cannot be projected backwards without compatible historical xG, shots and playing-time records.
More importantly, VAR promises more accurate critical decisions, not more goals. A stronger test would examine interventions, correctness and consistent treatment of comparable incidents. Scores describe changing outcomes; examining the decisions themselves is needed to establish how much of that change belongs to VAR.
The strongest finding is therefore not that VAR brought more goals. Some research identifies changes in penalties and cautions; our longer-window scoring rise is small and the home-win shift is sensitive to pandemic controls. There is no clear red-card break. Results alone also cannot establish that VAR is unnecessary: decision accuracy is a separate part of its purpose.